Learning the basics of Tableau in one night might be a bit challenging, but we will provide you with a step-by-step guide to help you get started. Keep in mind that Tableau is a powerful data visualization tool with many features, so this guide will cover the fundamentals to get you started.
- Installation and Setup:
- Visit the Tableau website and download the free trial or Tableau Public version.
- Install Tableau on your computer following the provided instructions.
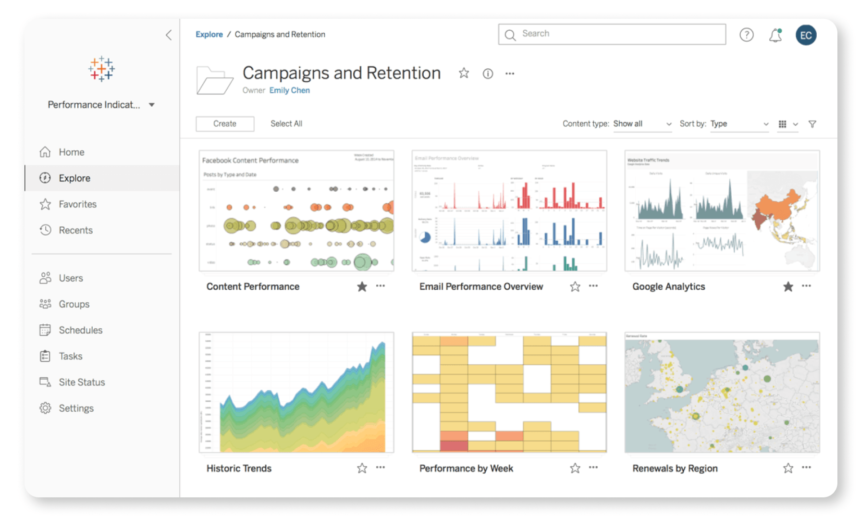
- Getting Familiar with the Interface:
- Launch Tableau and explore the different areas of the interface.
- Familiarize yourself with the toolbar, data pane, shelves, and worksheets.
- Understand the purpose of each area and how they relate to building visualizations.
- Connecting to Data:
- Learn how to connect to different data sources, such as Excel, CSV files, or databases.
- Import a sample dataset or use a provided dataset within Tableau.
- Understand how to work with multiple tables and join them if needed.
- Building Basic Visualizations:
- Drag and drop fields from the data pane onto the shelves to create a visualization.
- Experiment with different chart types (bar, line, pie, etc.) to visualize your data.
- Modify the properties of the visualization (e.g., color, size, labels) to enhance its appearance.
- Filtering and Sorting Data:
- Apply filters to focus on specific subsets of your data.
- Learn how to sort data by various criteria.
- Explore different filtering options, such as quick filters and context filters.
- Creating Calculated Fields:
- Understand how to create calculated fields using formulas.
- Experiment with basic calculations like sums, averages, or percentages.
- Use calculated fields to perform more advanced calculations or create custom metrics.
- Adding Interactivity:
- Learn how to create interactive dashboards by adding actions and filters.
- Connect visualizations together to create a linked experience for end-users.
- Explore the options to add tooltips, actions, and filters to enhance interactivity.
- Formatting and Styling:
- Customize the appearance of your visualizations using formatting options.
- Adjust labels, titles, colors, and fonts to make your visualizations visually appealing.
- Experiment with different layout options to optimize the use of space.
- Publishing and Sharing:
- Explore different publishing options available in Tableau, such as Tableau Server or Tableau Public.
- Learn how to save your work and export visualizations in different formats.
- Understand the sharing options available and how to embed or share your visualizations.
- Practice and Explore:
- Work with different datasets and experiment with various chart types and features.
- Visit the Tableau website for tutorials, resources, and sample workbooks.
- Join Tableau user communities or forums to ask questions and learn from others.
Remember that Tableau is a versatile tool, and this guide only covers the basics. To master Tableau, continuous practice, exploring advanced features, and working with real-world datasets are essential.
For more such content, keep reading @techinnews
